UK Urban Systems Network#
Regional urban systems from commuting flows
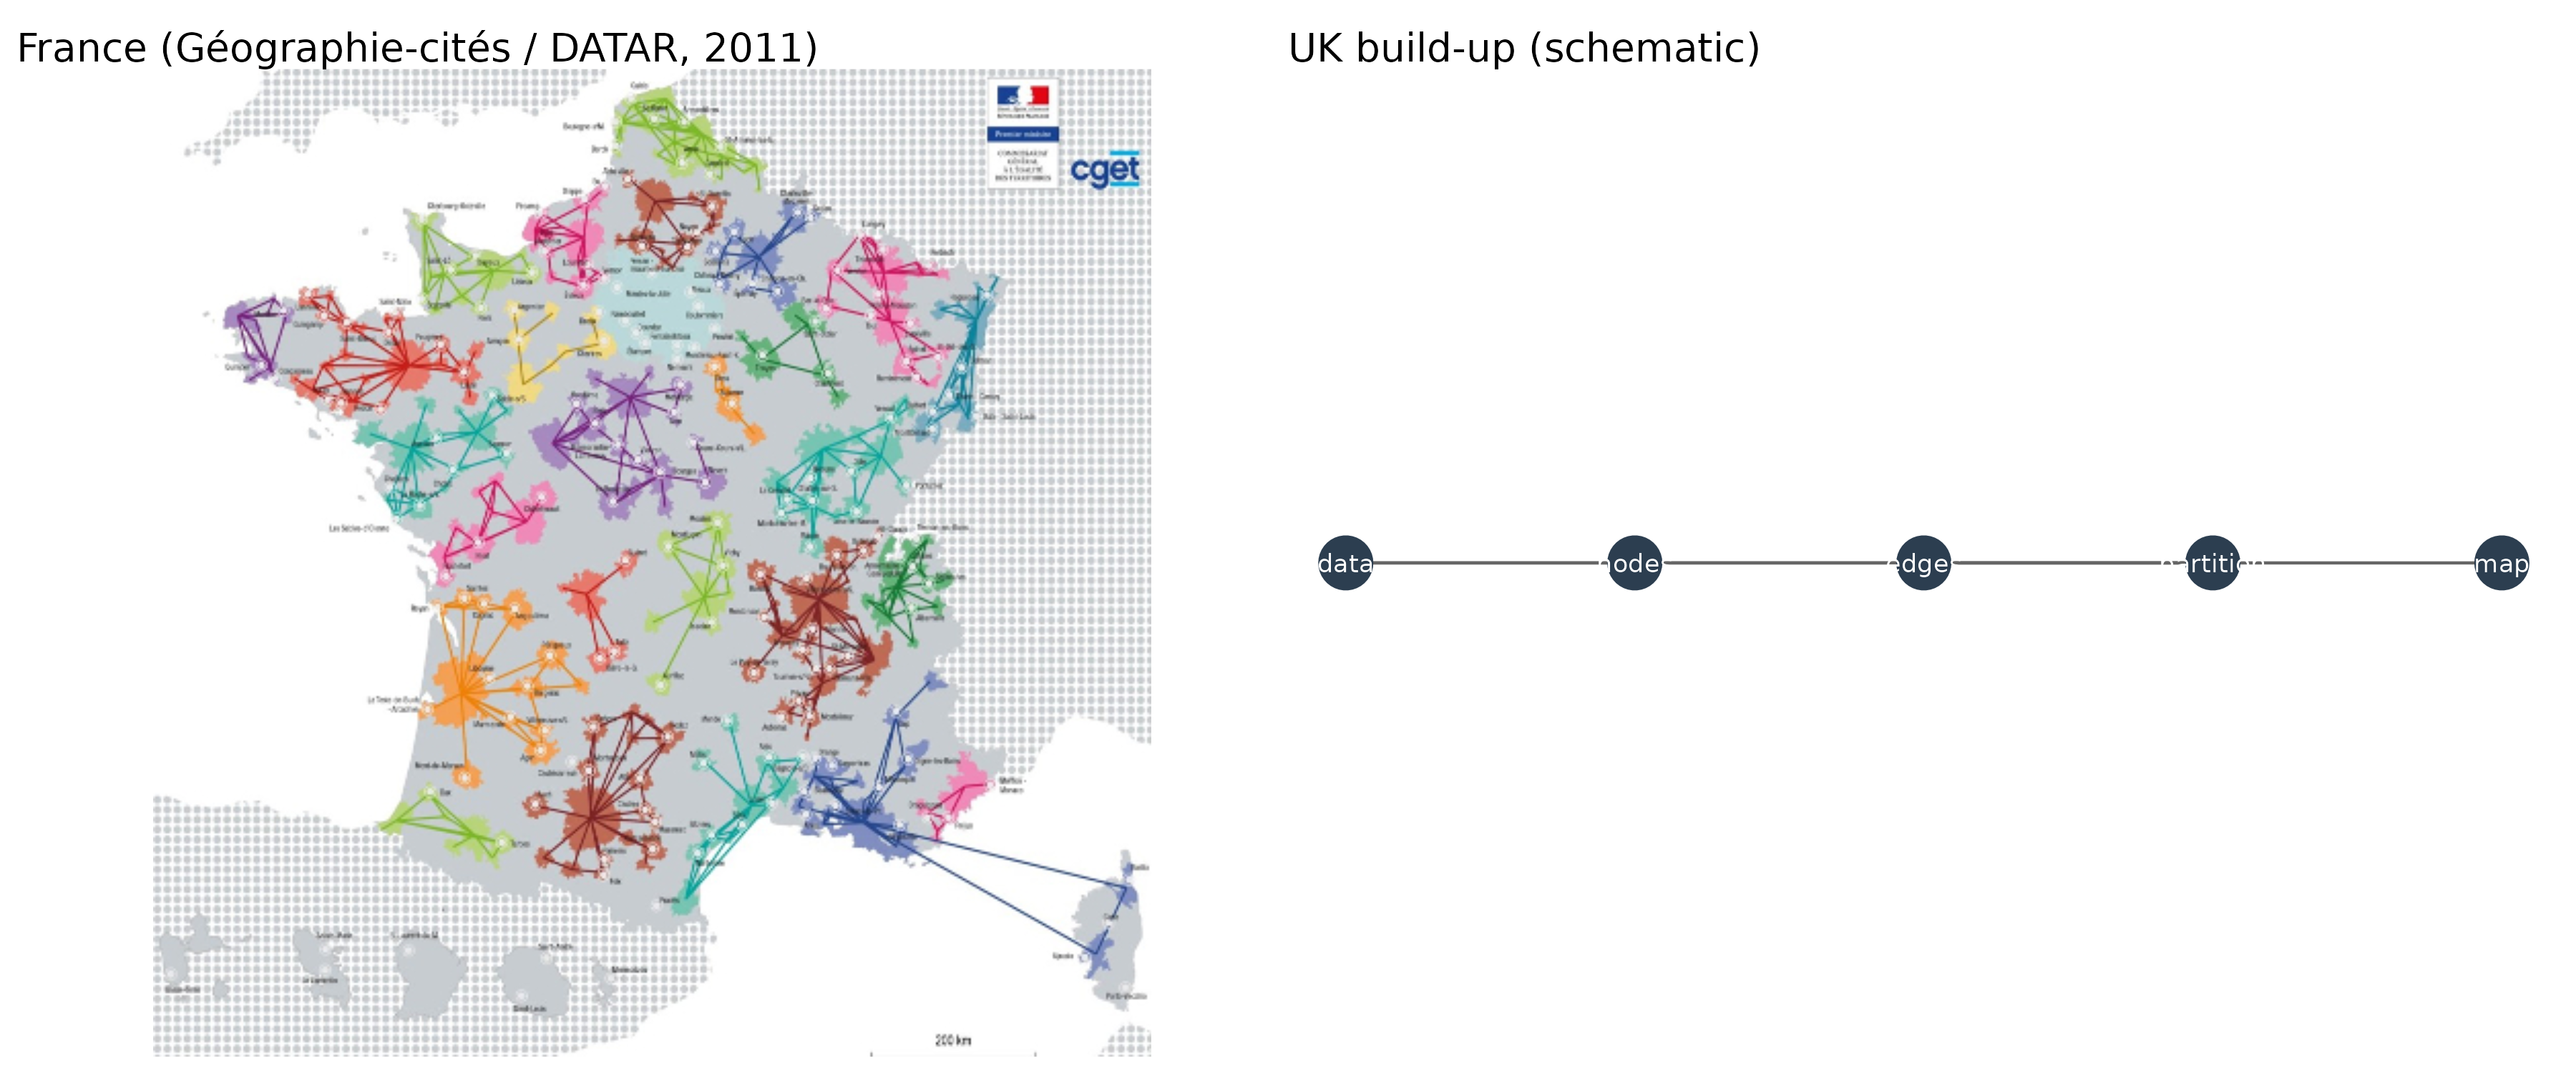
A UK replication of the French systèmes urbains régionaux cartogram (Géographie-cités / DATAR, 2011)
Project overview#
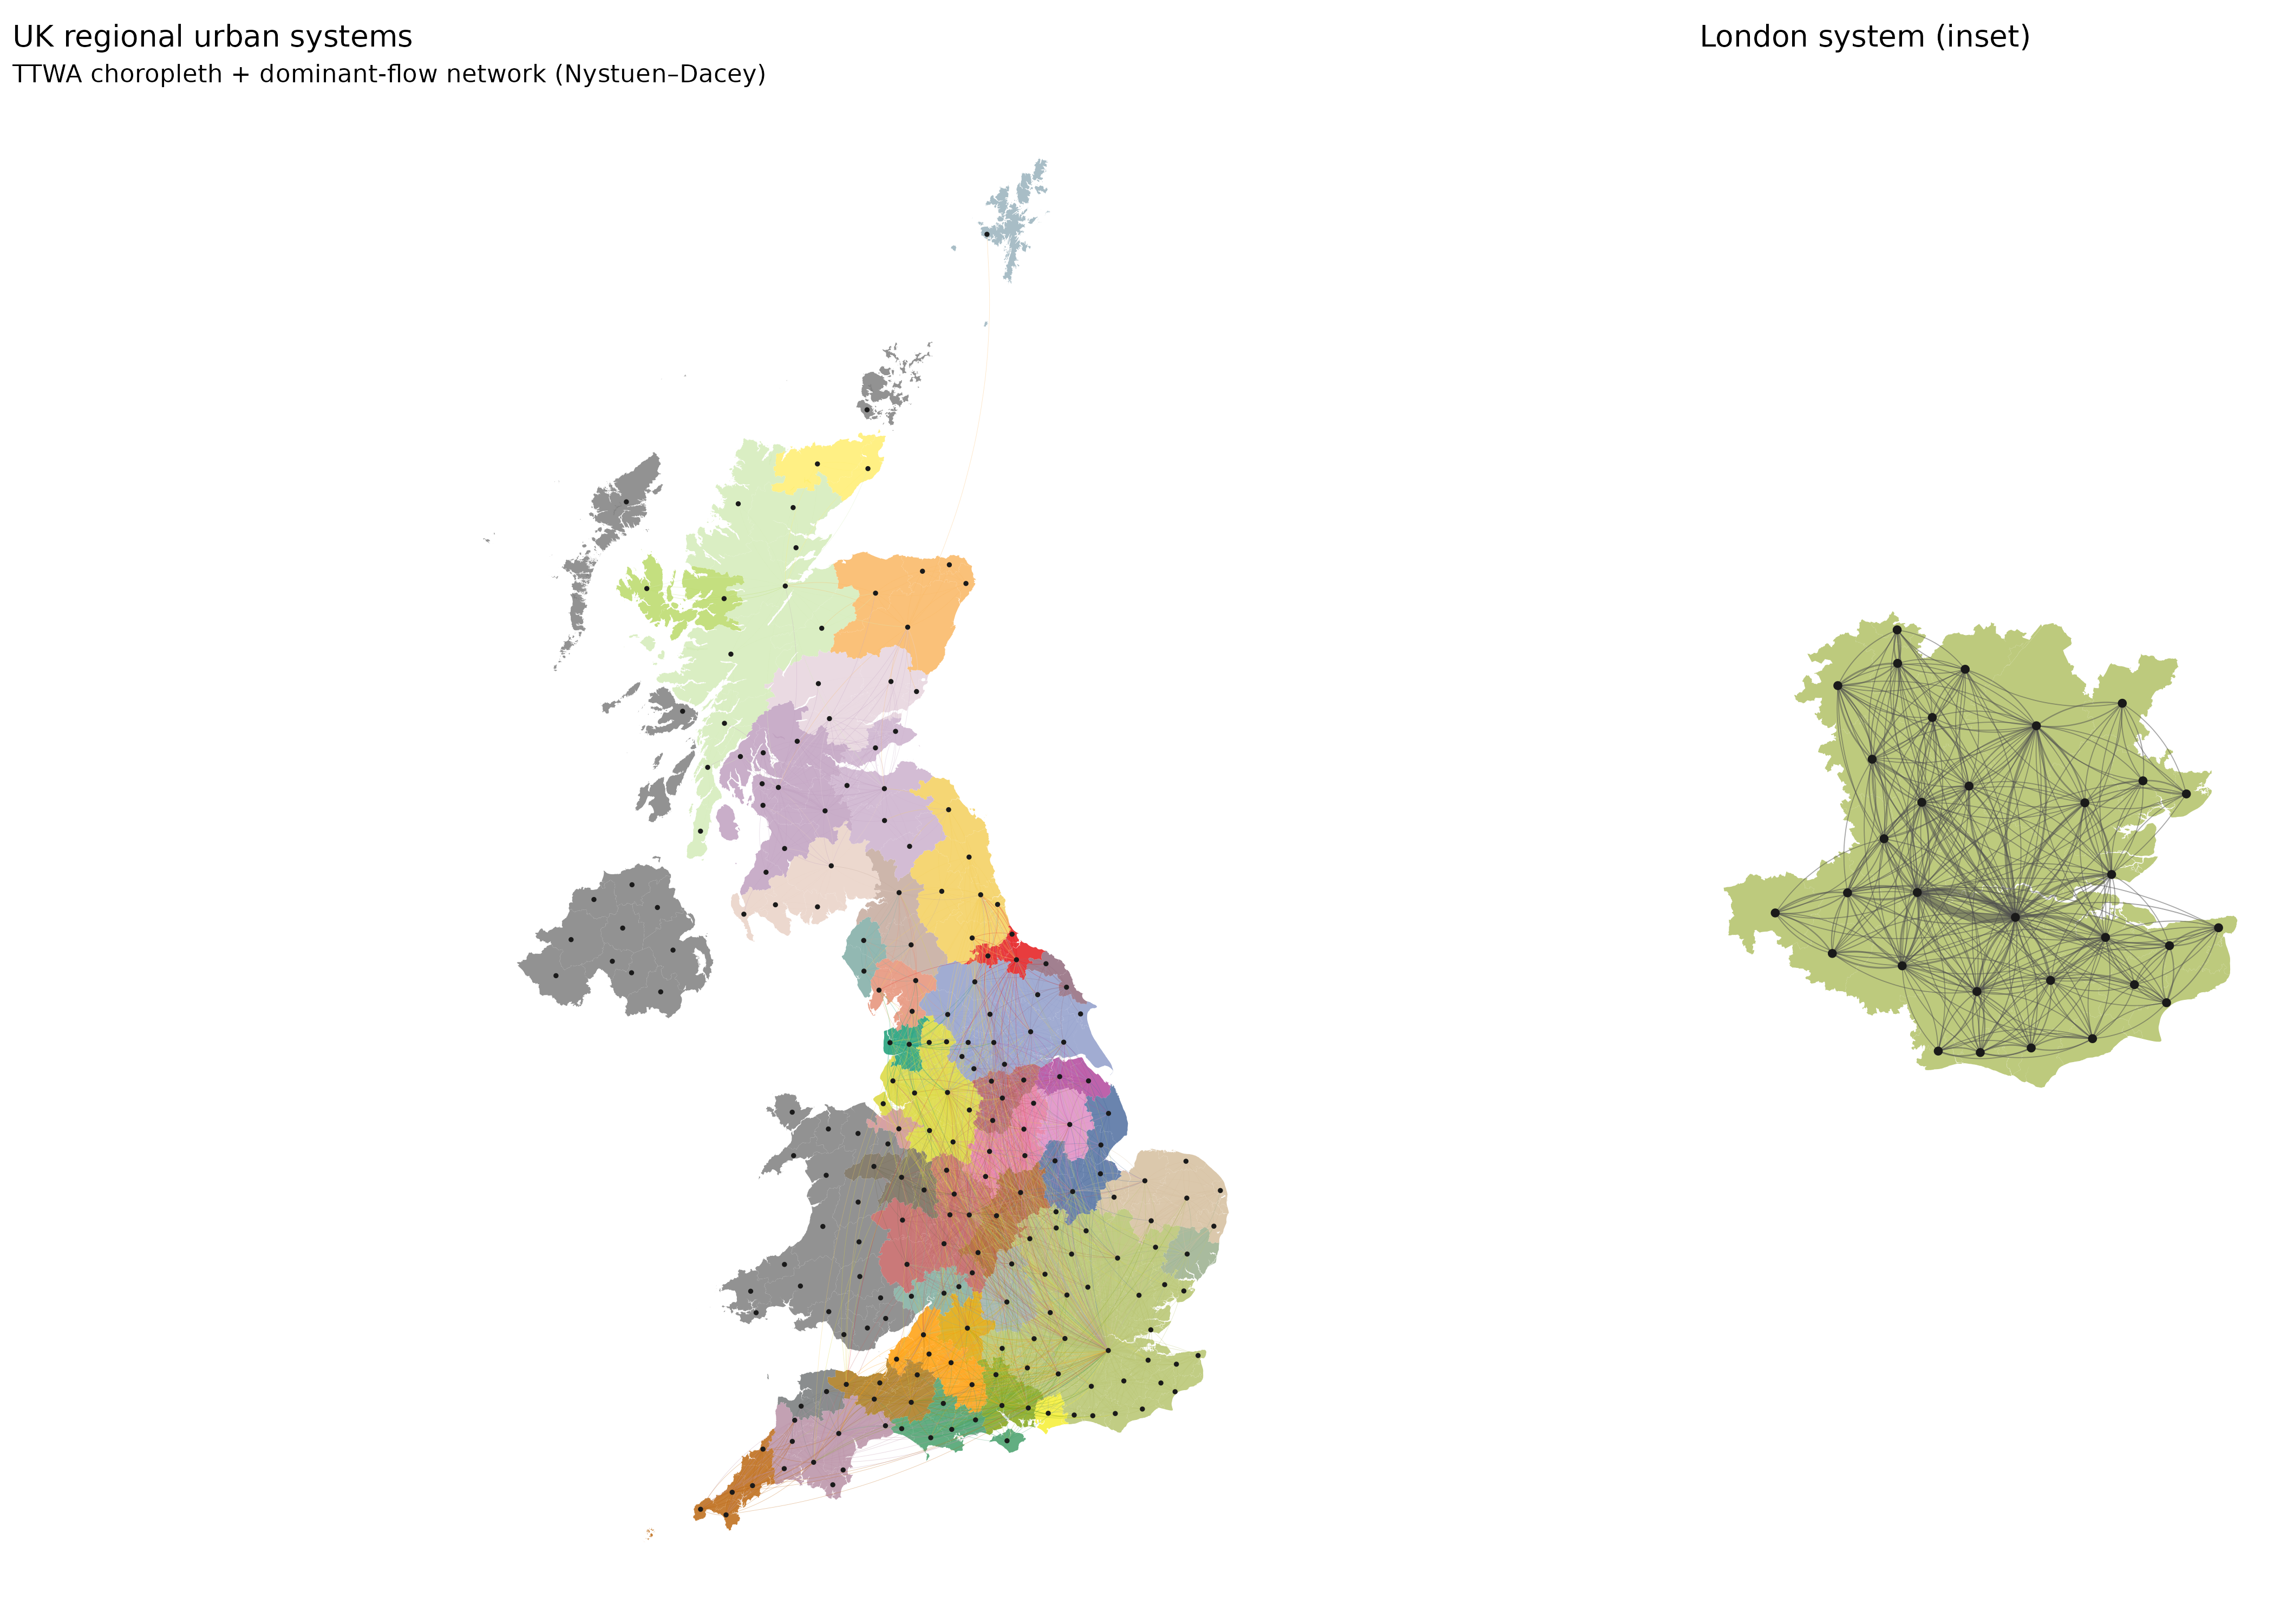
This project builds a spatially embedded network of UK functional urban areas, linked by preferential commuting and economic ties, and partitioned into regional urban systems using the Nystuen–Dacey dominant-flow algorithm. The narrative walks through the map incrementally: from raw census and boundary data to nodes, edges, regional partitions, and a final styled cartogram with choropleth fill and a London inset—mirroring the treatment of Paris in the original French map.
The methodology is deliberately aligned with the Géographie-cités / DATAR (2011) approach[1]: nodes are Travel to Work Areas (TTWAs, 2011 definition), edges aggregate workplace-to-residence flows, and regional colours mark dominant-flow partitions—not modularity clustering.
Motivation#
France’s 2011 cartogram showed how 26 systèmes urbains régionaux emerge from everyday mobility: each node is a functional urban area, each edge a preferential link, and each colour a nodal region defined by the largest outward commuting tie. The UK has comparable TTWA geography and rich census OD data, making a British replication a natural extension of that work—while keeping the same Route B partition logic (Nystuen–Dacey) rather than community-detection shortcuts.
Methodology summary#
Nodes: TTWAs (2011 definition), boundaries from the ONS Open Geography Portal (UK-wide, including Wales and Scotland).
Edges (England & Wales): Census 2021 MSOA workplace flows (
ODWP01EW), aggregated to TTWA via a UK MSOA→TTWA lookup.Edges (Scotland): Census 2022 Intermediate Zone workplace flows, aggregated to TTWA via the 2011 Data Zone lookup.
Census caveat: This is a comparative UK map, not a single harmonised census product—EW 2021 and Scotland 2022 are combined on 2011 TTWA geography.
Partition: Nystuen–Dacey dominant-flow / nodal regions—implemented explicitly in R; no
cluster_louvainorcluster_infomap.Maps: Static PNG figures plus interactive Leaflet widgets in chapters 06 and 07 (pan/zoom, TTWA popups, country layer toggles).
Preview figures#
Project structure#
Seven notebooks build the map step by step:
Key technologies#
Package |
Role |
|---|---|
tidyverse / data.table |
Data wrangling and tables |
sf |
Simple features for boundaries and centroids |
httr2 / readxl |
Download and parse Scotland OD Excel |
sfnetworks / tidygraph / igraph |
Spatial network construction |
ggraph |
Network plotting |
ggplot2 / patchwork |
Static cartogram + London inset |
leaflet / htmlwidgets / IRdisplay |
Interactive maps embedded in the book |
here |
Reproducible paths from the repo root |
Kernel: IRkernel (R). Install dependencies via r-requirements.R.
Refresh cached data and RDS outputs:
Rscript projects/uk-urban-systems-network/scripts/fetch_live_data.R
Rscript projects/uk-urban-systems-network/scripts/run_pipeline.R
Data sources#
Source |
Role |
|---|---|
ONS Open Geography Portal |
TTWA boundaries (2011, UK), MSOA/LSOA/TTWA lookups |
NOMIS / Census 2021 |
England & Wales MSOA workplace OD ( |
Scotland’s Census 2022 |
IZ workplace OD (Part 6, Table 6b) |
statistics.gov.scot |
Data Zone 2011 lookup (IZ → TTWA) |
Géographie-cités / DATAR (2011) |
Conceptual and visual reference cartogram |
See Data acquisition for download paths and ingest details. Place the French reference image at _static/uk-urban-systems-network/french_datar_2011.png before building chapter 01.
Interactive map HTML is written to _static/uk-urban-systems-network/maps/ when notebooks 06–07 run (gitignored; rebuilt on CI).
Ready to explore?