Data cleaning#
This chapter aggregates MSOA-level flows to TTWA pairs, removes self-loops, filters low-volume edges, and computes population-weighted centroids for each TTWA.
Previous: Data acquisition
Next: Nodes
suppressPackageStartupMessages({
  library(tidyverse)
  library(sf)
  library(ggplot2)
  library(scales)
  library(here)
})
proj_dir <- here::here("projects", "uk-urban-systems-network")
data_dir <- file.path(proj_dir, "data")
fig_dir <- file.path(proj_dir, "figures")
dir.create(data_dir, recursive = TRUE, showWarnings = FALSE)
dir.create(fig_dir, recursive = TRUE, showWarnings = FALSE)
rds_ttwa <- file.path(data_dir, "ttwa_boundaries.rds")
rds_od <- file.path(data_dir, "od_flows_raw.rds")

ttwa_boundaries <- readRDS(rds_ttwa)
od_flows_raw <- readRDS(rds_od)
Aggregate MSOA flows to TTWA pairs#
msoa_ttwa <- readRDS(file.path(data_dir, "msoa_ttwa_lookup.rds"))

aggregate_msoa_to_ttwa <- function(od, lookup) {
  lookup_unique <- lookup |>
    group_by(msoa11cd) |>
    slice_head(n = 1) |>
    ungroup()
  od |>
    filter(geo_level == "MSOA") |>
    left_join(lookup_unique |> rename(origin_ttwa = ttwa11cd, residence_msoa = msoa11cd), by = "residence_msoa") |>
    left_join(lookup_unique |> rename(dest_ttwa = ttwa11cd, workplace_msoa = msoa11cd), by = "workplace_msoa") |>
    filter(!is.na(origin_ttwa), !is.na(dest_ttwa)) |>
    group_by(origin_ttwa, dest_ttwa) |>
    summarise(flow = sum(flow, na.rm = TRUE), .groups = "drop")
}

od_ttwa_ew <- aggregate_msoa_to_ttwa(od_flows_raw, msoa_ttwa)

od_ttwa_sc <- od_flows_raw |>
  filter(geo_level == "TTWA") |>
  transmute(
    origin_ttwa = residence_msoa,
    dest_ttwa = workplace_msoa,
    flow
  )

od_ttwa_pairs_raw <- bind_rows(od_ttwa_ew, od_ttwa_sc)

summary_before <- tibble(
  stage = "Before filtering",
  n_nodes = n_distinct(c(od_ttwa_pairs_raw$origin_ttwa, od_ttwa_pairs_raw$dest_ttwa)),
  n_edges = nrow(od_ttwa_pairs_raw),
  total_flow = sum(od_ttwa_pairs_raw$flow)
)
MIN_FLOW <- 50L

od_ttwa_pairs <- od_ttwa_pairs_raw |>
  filter(origin_ttwa != dest_ttwa, flow >= MIN_FLOW)

summary_after <- tibble::tibble(
  stage = "After filtering",
  n_nodes = n_distinct(c(od_ttwa_pairs$origin_ttwa, od_ttwa_pairs$dest_ttwa)),
  n_edges = nrow(od_ttwa_pairs),
  total_flow = sum(od_ttwa_pairs$flow)
)

bind_rows(summary_before, summary_after)
| stage | n_nodes | n_edges | total_flow |
|---|---|---|---|
| <chr> | <int> | <int> | <int> |
| Before filtering | 199 | 18706 | 14585107 |
| After filtering | 196 | 2726 | 3517126 |
# Population-weighted centroids (geometric centroid per TTWA; pop from census OD)
ttwa_centroids <- ttwa_boundaries |>
  mutate(geometry = sf::st_point_on_surface(geometry)) |>
  select(ttwa11cd, ttwa11nm, country, working_age_pop, geometry)

ttwa_population <- ttwa_boundaries |>
  st_drop_geometry() |>
  select(ttwa11cd, working_age_pop)

saveRDS(od_ttwa_pairs, file.path(data_dir, "od_ttwa_pairs.rds"))
saveRDS(ttwa_centroids, file.path(data_dir, "ttwa_centroids.rds"))
saveRDS(ttwa_population, file.path(data_dir, "ttwa_population.rds"))
Warning message:
“There was 1 warning in `stopifnot()`.
ℹ In argument: `geometry = sf::st_point_on_surface(geometry)`.
Caused by warning in `st_point_on_surface.sfc()`:
! st_point_on_surface may not give correct results for longitude/latitude data”
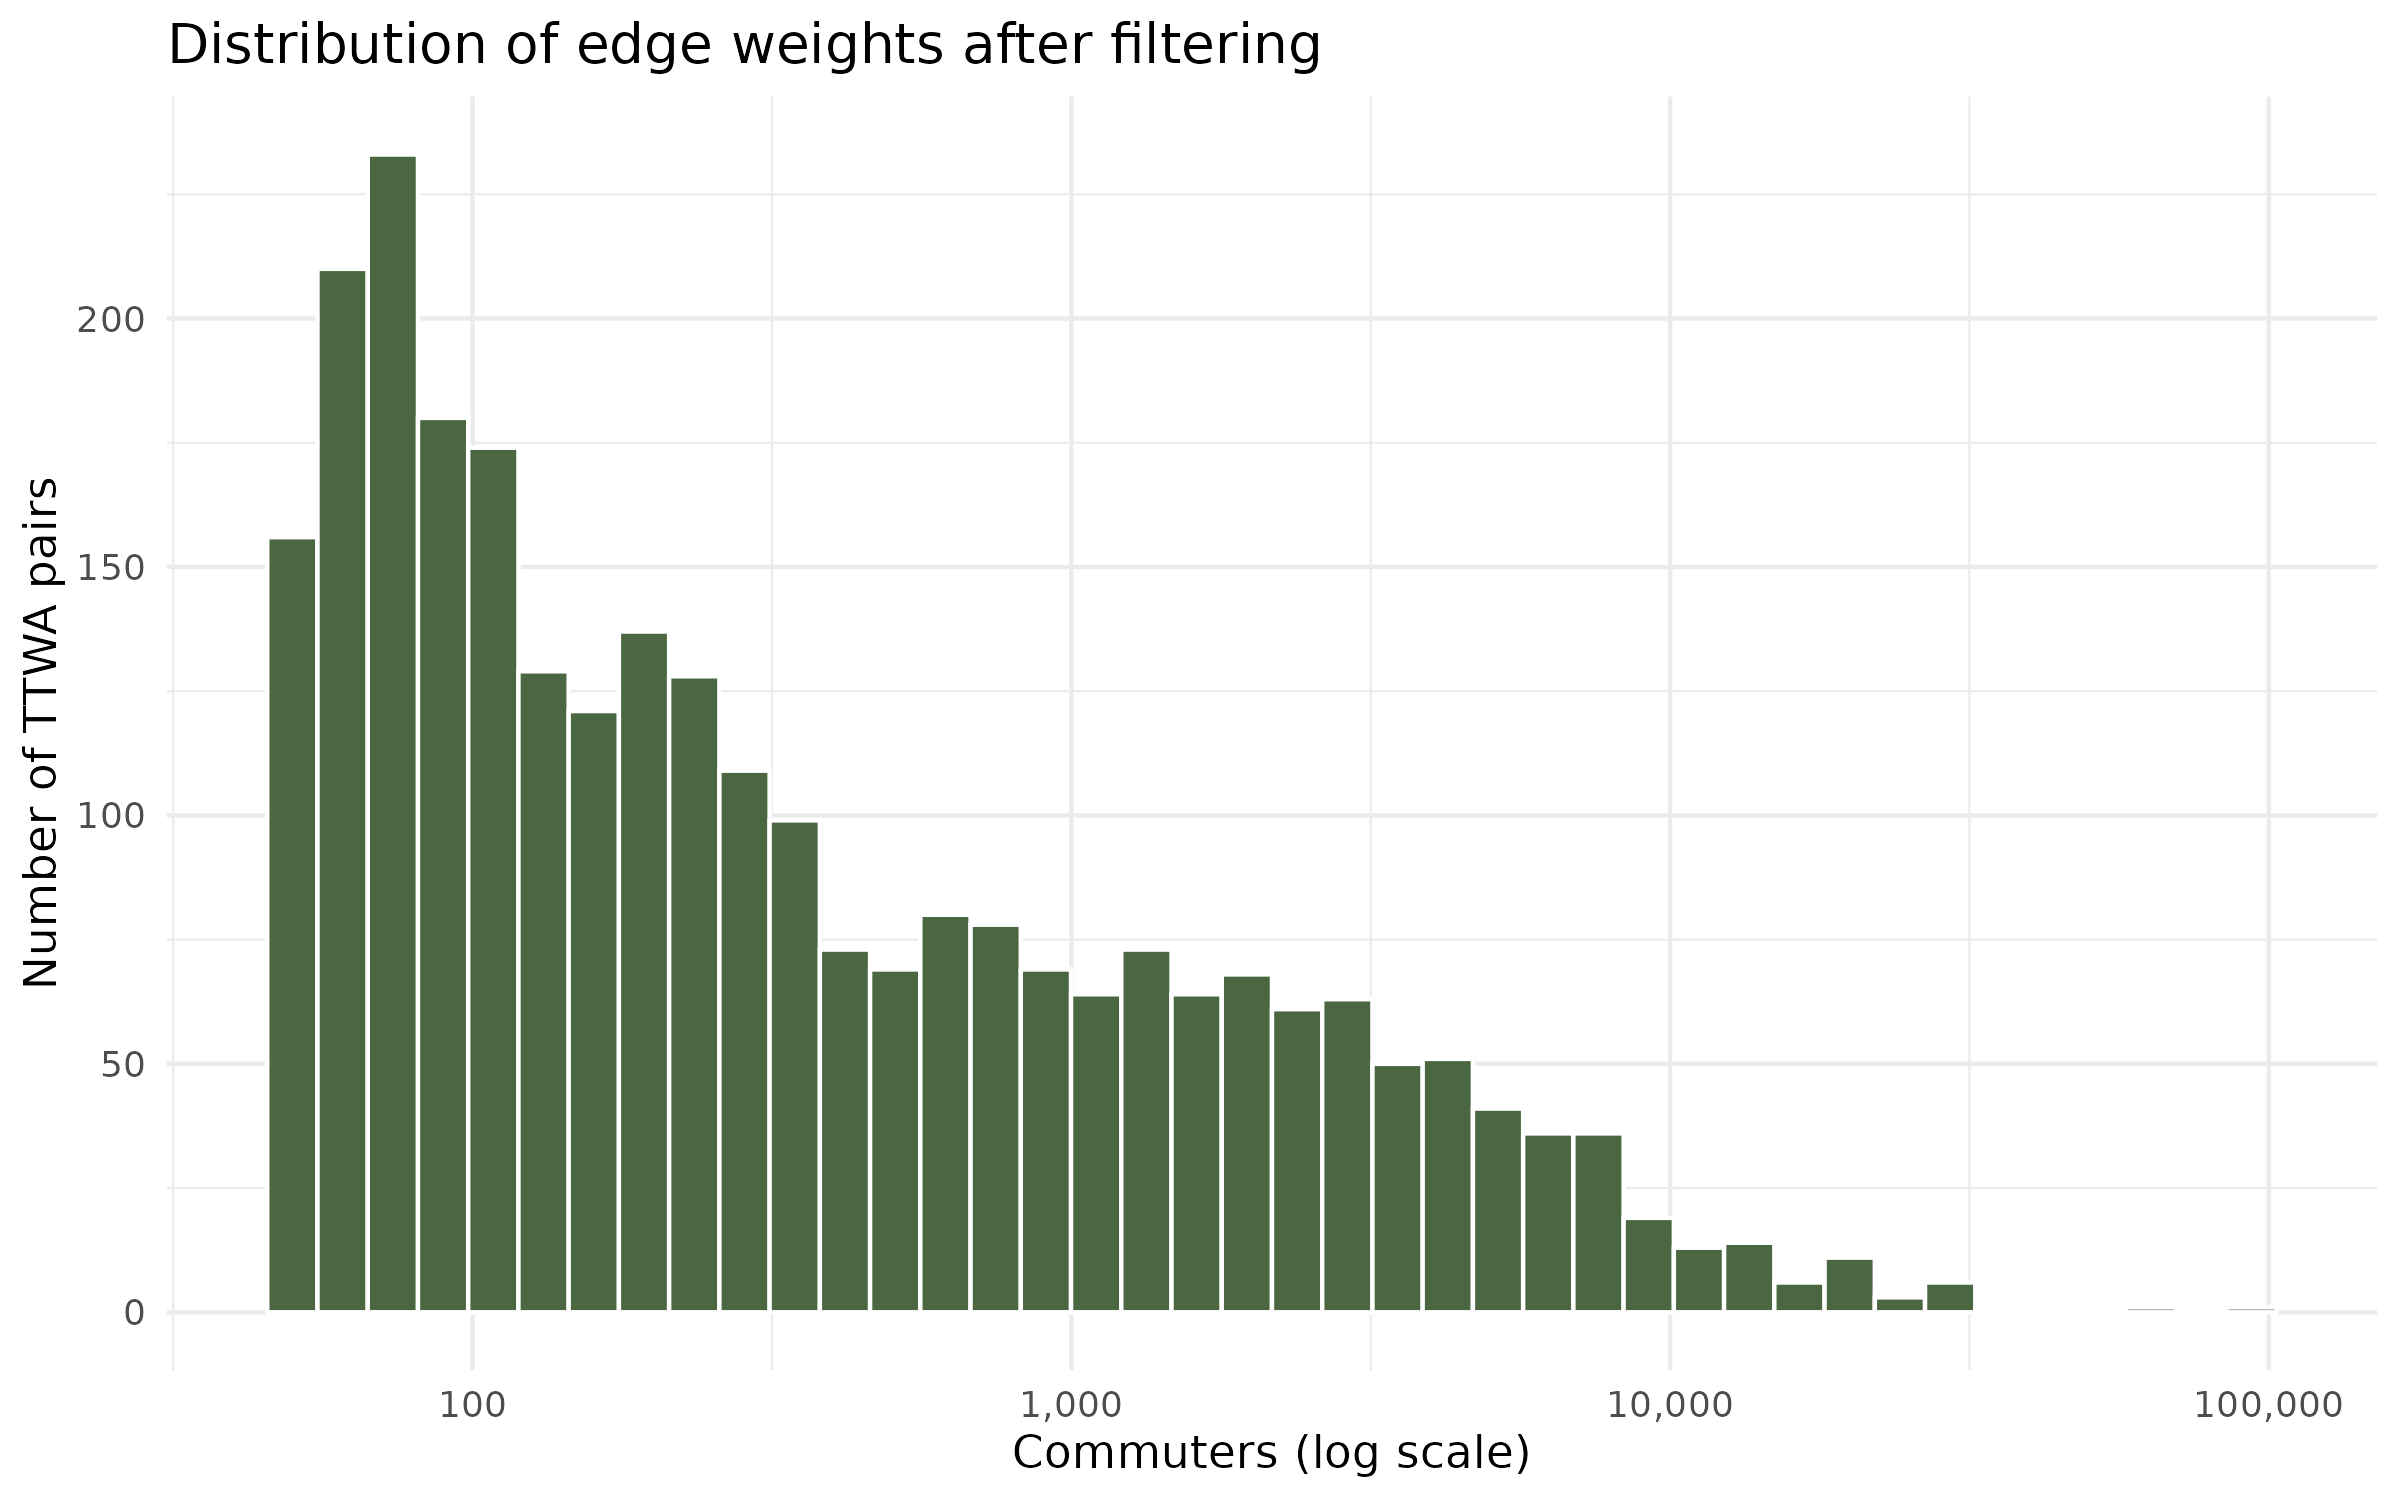
Edge weight distribution#
p_hist <- ggplot(od_ttwa_pairs, aes(x = flow)) +
  geom_histogram(bins = 40, fill = "#4a6741", colour = "white") +
  scale_x_log10(labels = scales::comma) +
  labs(
    x = "Commuters (log scale)",
    y = "Number of TTWA pairs",
    title = "Distribution of edge weights after filtering"
  ) +
  theme_minimal()

fig_hist <- file.path(fig_dir, "03_edge_weight_hist.png")
ggsave(fig_hist, p_hist, width = 8, height = 5, dpi = 300)
invisible(fig_hist)
Data sources#
Next: Nodes →