Power Laws and Popularity#
What 500 artists can and cannot tell you about streaming success
A synthetic Spotify catalog, treated as a small-n inference problem wearing an ML costume
Project Overview#
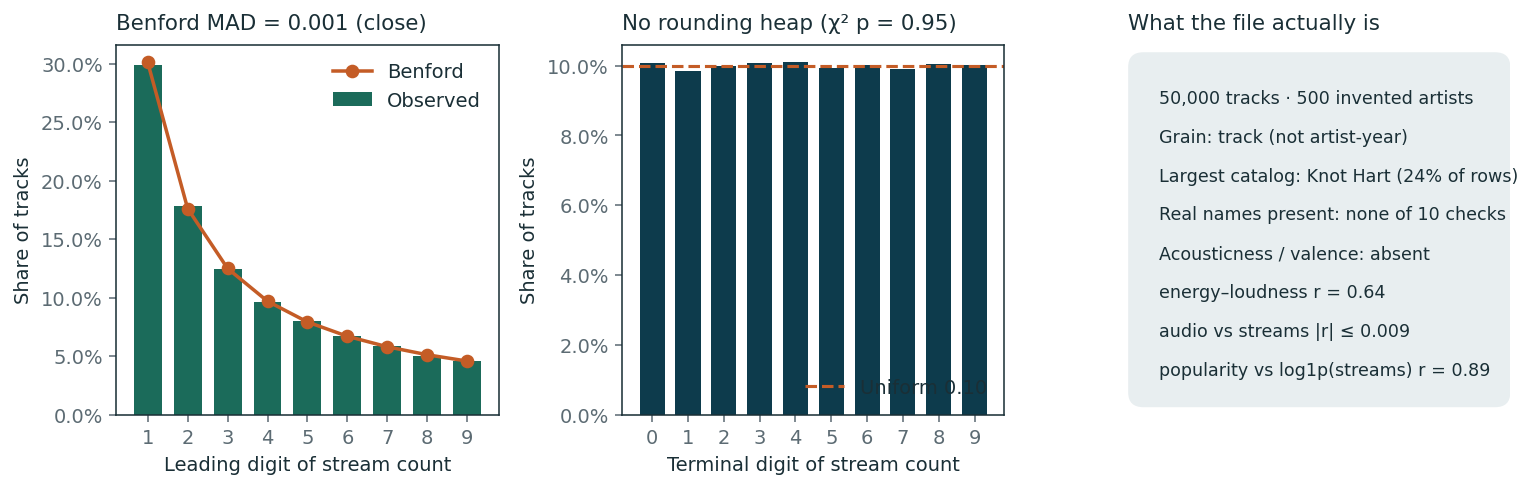
Kaggle will sell you 50,000 rows and 33 columns of “Spotify artist streaming analytics, 2020–2025”. That looks like a machine-learning problem. It is not. After a schema check the grain is track, not artist-year; the names are generated; audio features are orthogonal to streams; and popularity is almost log1p of the target. The interesting work is estimand definition, a leakage audit, validation that matches the clustering, and stopping when extra model capacity stops paying.
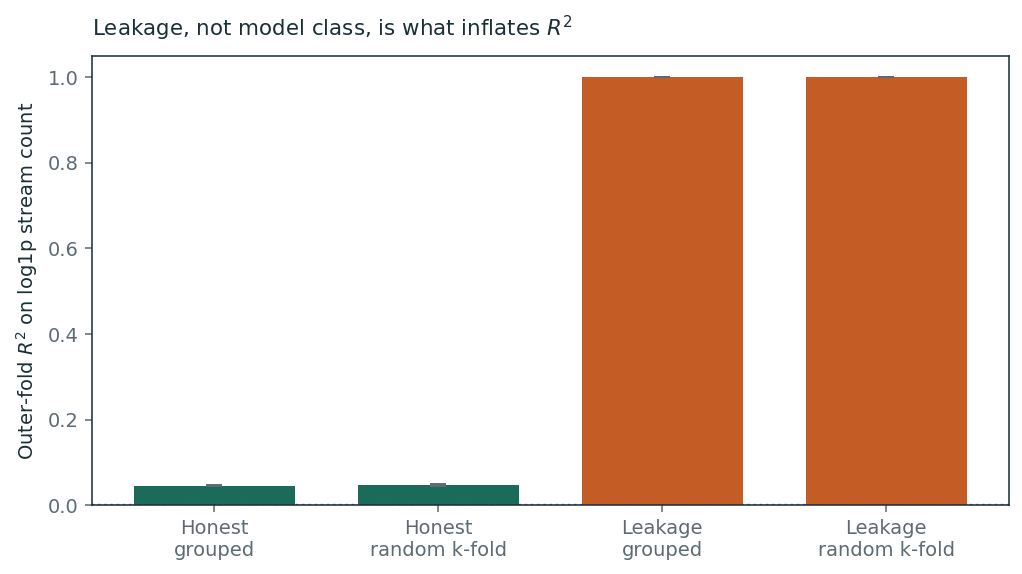
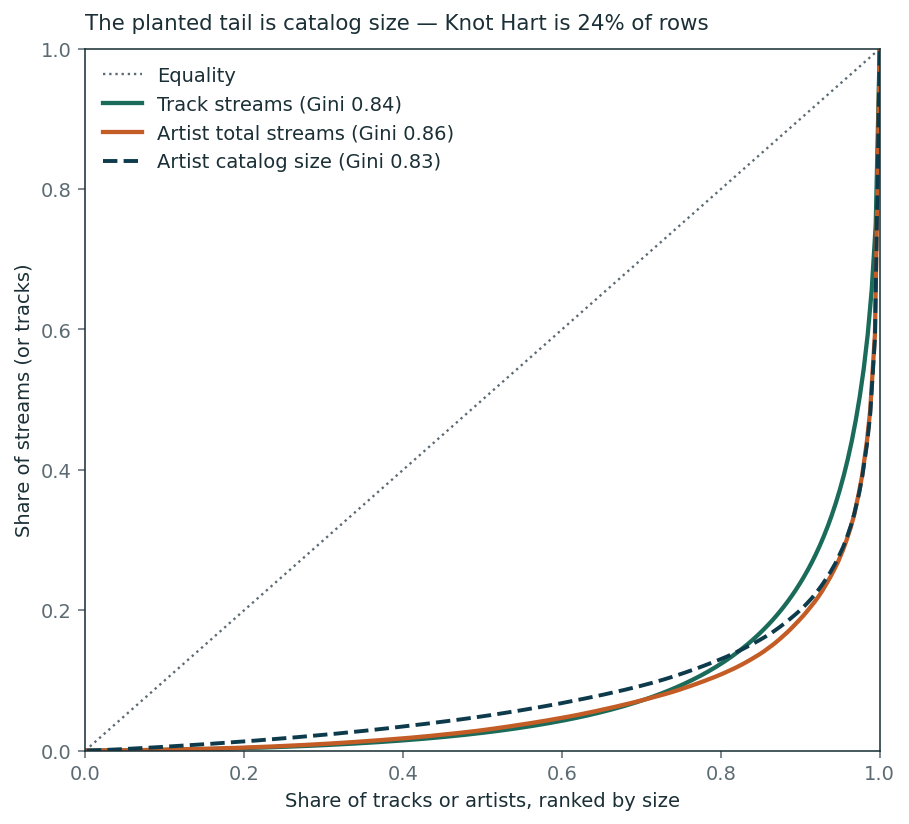
The honest conclusion is the one worth publishing: flexible models buy nothing at this generating process, leaked features buy (R^2 = 1), and the planted superstar tail is catalog size rather than quality.
The pages#
Code lives in src/spotify_powerlaws/ and numbered scripts; notebooks load artifacts.
1. Streams and leakage
Forensics, estimand, grouped CV, model ladder, power-law tests, conformal coverage
2. Genre from audio
The unused signal: recover planted genre from audio, with grouped-by-artist validation
Key questions#
Is this an artist panel, a track catalog, or a synthetic script with a Spotify costume?
Which columns are antecedent to streams, and which are the target in disguise?
Does grouped-by-artist CV change the honest model — or only fail to save a tautological one?
When does added capacity stop paying, and does partial pooling find artist effects the ANOVA already said were zero?
Did the generator couple audio to genre even though it did not couple audio to streams?
Preview figures#
Dataset#
Source: Kaggle: Spotify Artist Streaming Analytics 2020–2025 (CC BY 4.0)
File: 50,000 tracks × 33 columns; 500 invented artists
Grain: track (
track_idunique). Not artist-year, not a listening panelRebuild:
make downloadwritesdata/raw/(gitignored). SHA-256 inartifacts/download.jsonThis site: notebooks read committed
artifacts/andfigures/only
Technical stack#
Python • pandas • scikit-learn • statsmodels MixedLM • matplotlib • scipy
Pipeline: projects/spotify-power-laws/Makefile (00_download.py … 09_genre.py)
Start with the forensics.