Nodes#
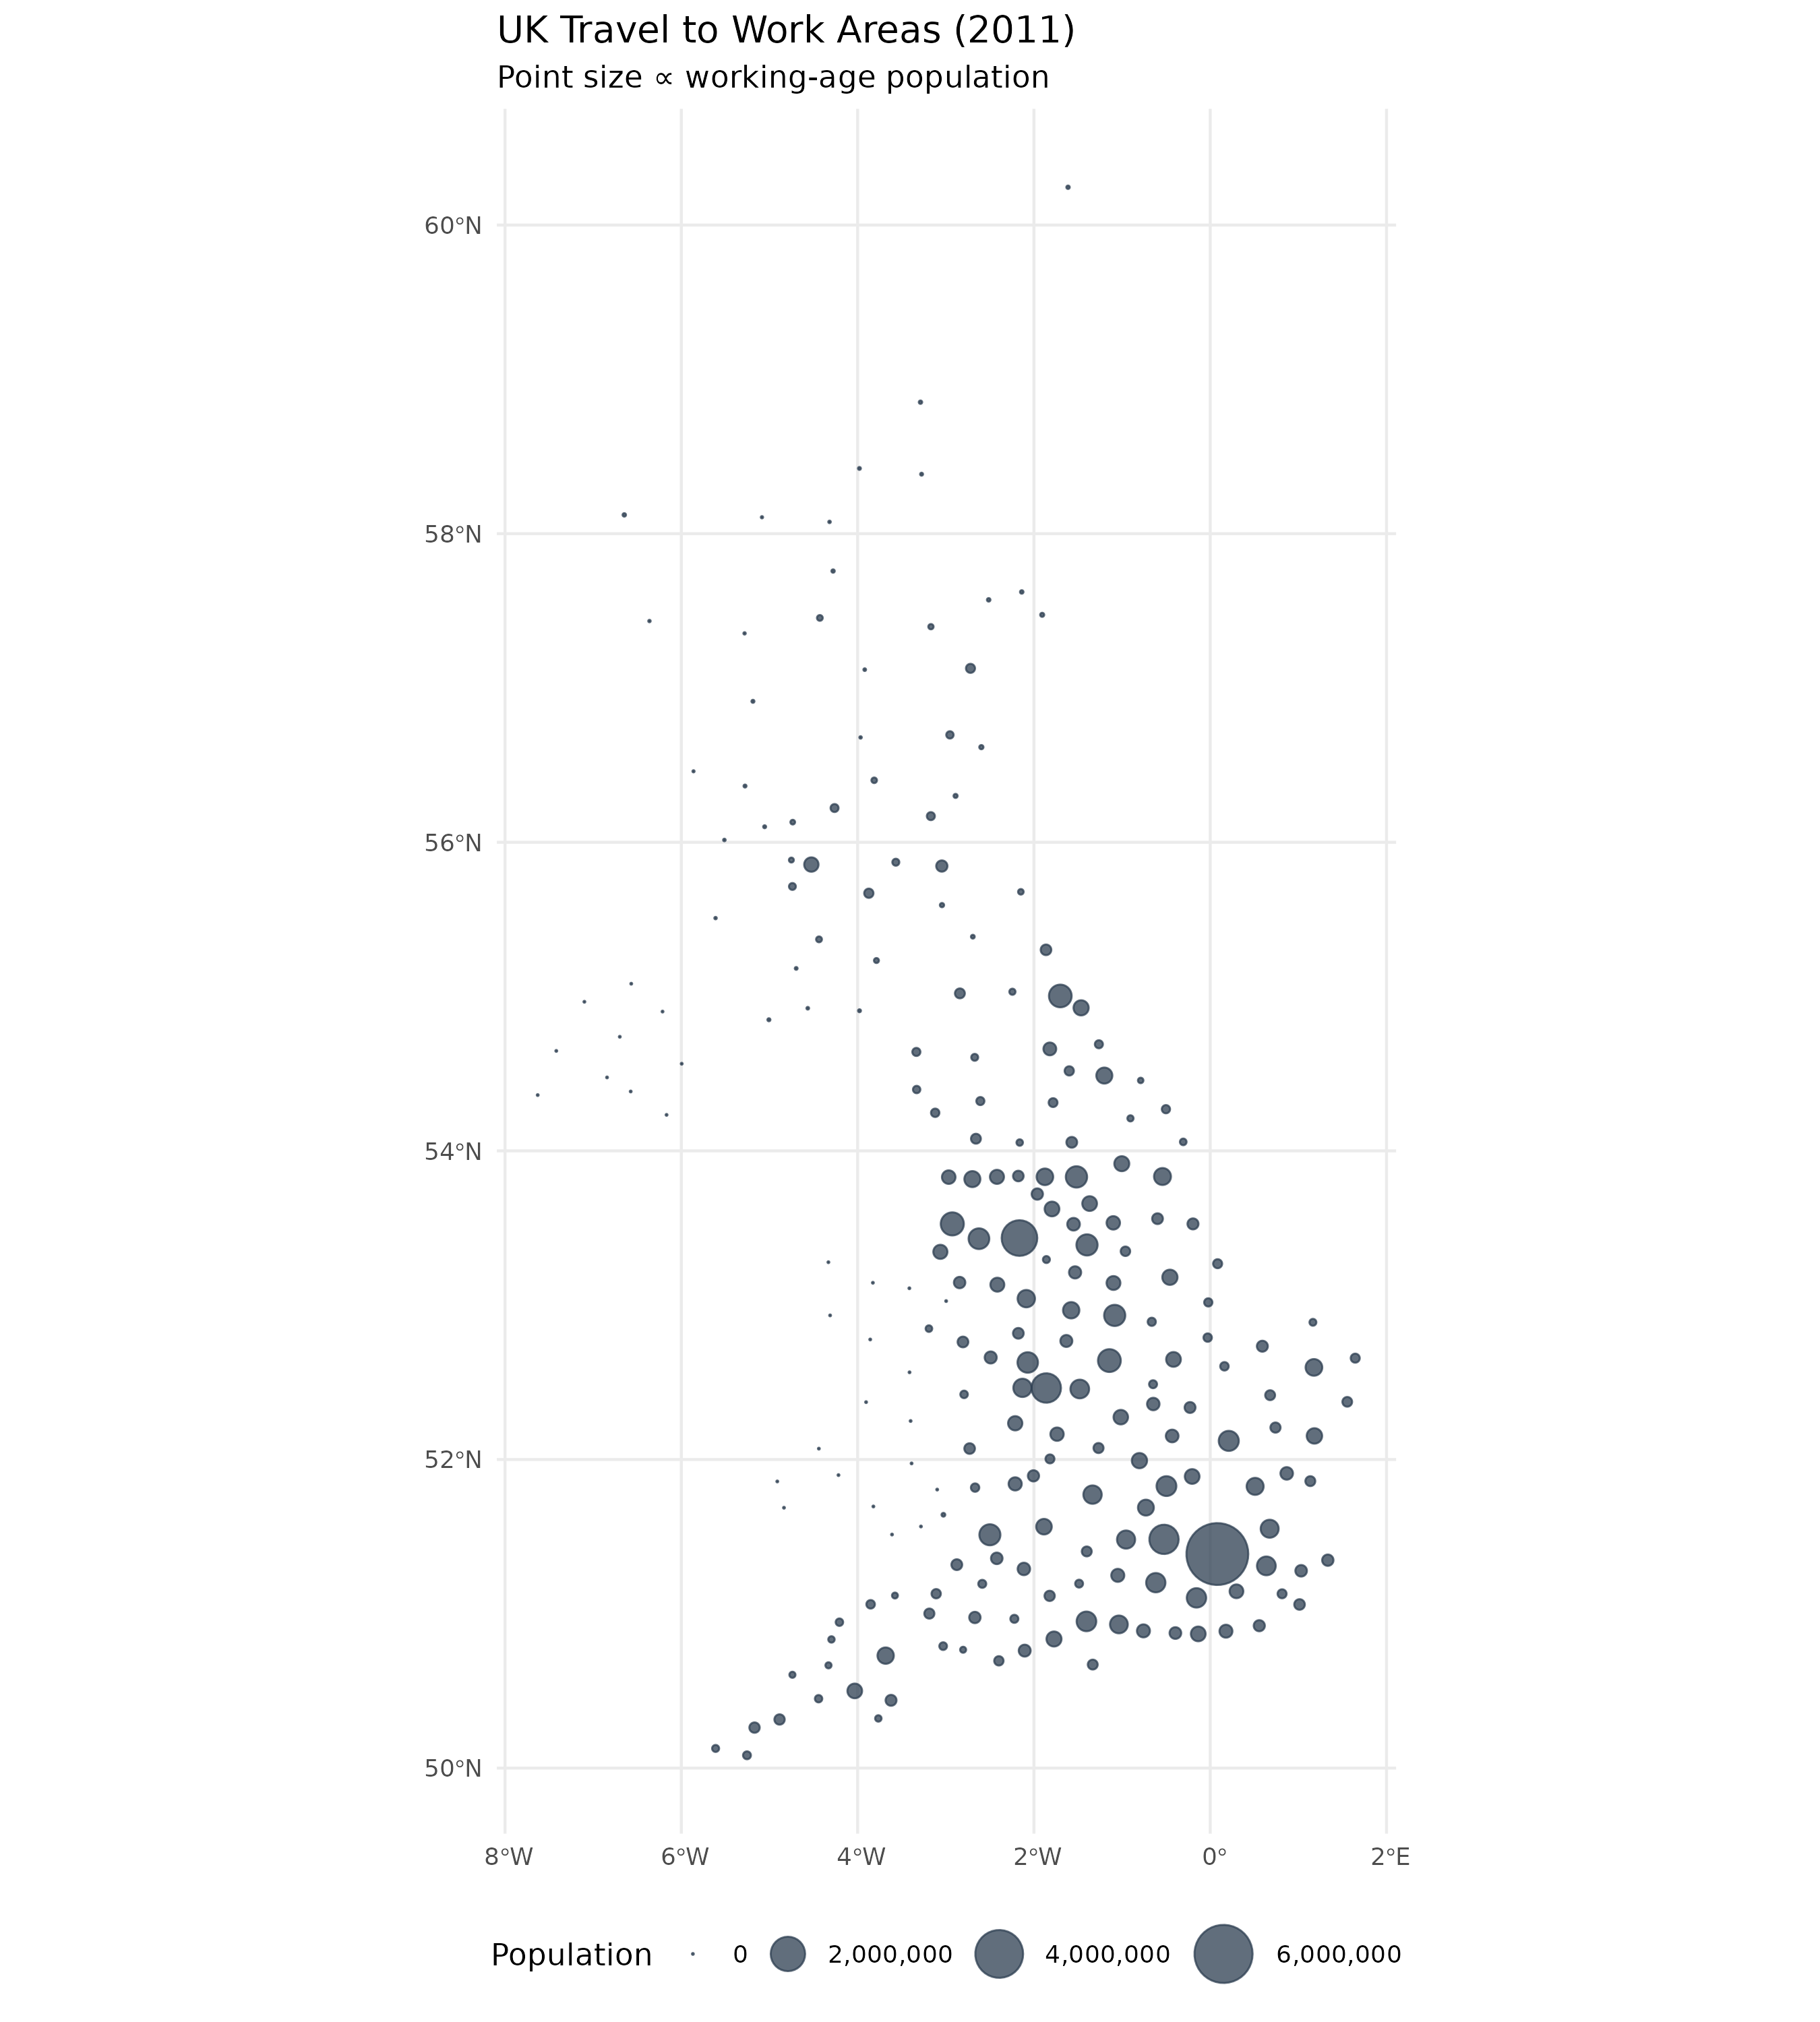
This chapter maps TTWA centroids only—the first geographic view of the network— with point size scaled by working-age population.
Previous: Data cleaning
Next: Flows
suppressPackageStartupMessages({
  library(sf)
  library(ggplot2)
  library(scales)
  library(here)
})
proj_dir <- here::here("projects", "uk-urban-systems-network")
data_dir <- file.path(proj_dir, "data")
fig_dir <- file.path(proj_dir, "figures")
dir.create(data_dir, recursive = TRUE, showWarnings = FALSE)
dir.create(fig_dir, recursive = TRUE, showWarnings = FALSE)
ttwa_centroids <- readRDS(file.path(data_dir, "ttwa_centroids.rds"))
TTWA centroid map#
p_nodes <- ggplot(ttwa_centroids) +
  geom_sf(aes(size = working_age_pop), colour = "#2c3e50", alpha = 0.75) +
  scale_size_area(labels = comma, max_size = 10) +
  coord_sf(crs = sf::st_crs(ttwa_centroids)) +
  labs(
    title = "UK Travel to Work Areas (2011)",
    subtitle = "Point size ∝ working-age population",
    size = "Population"
  ) +
  theme_minimal() +
  theme(legend.position = "bottom")

fig_nodes <- file.path(fig_dir, "04_nodes_map.png")
ggsave(fig_nodes, p_nodes, width = 9, height = 10, dpi = 300)
invisible(fig_nodes)
Next: Flows →