ODI Win Probability: From DLS to Data#
Ball-by-ball win probability for one-day cricket
Resource-based baselines and calibrated machine-learning models applied to ODI chases
Project Overview#
Live win-probability gauges have become a staple of cricket broadcasts — but how are those numbers computed? This project walks through the statistical machinery behind P(batting team wins | current state) in ODIs, from the resource logic underlying Duckworth–Lewis–Stern (DLS) rain rules to data-driven models trained on ball-by-ball history.
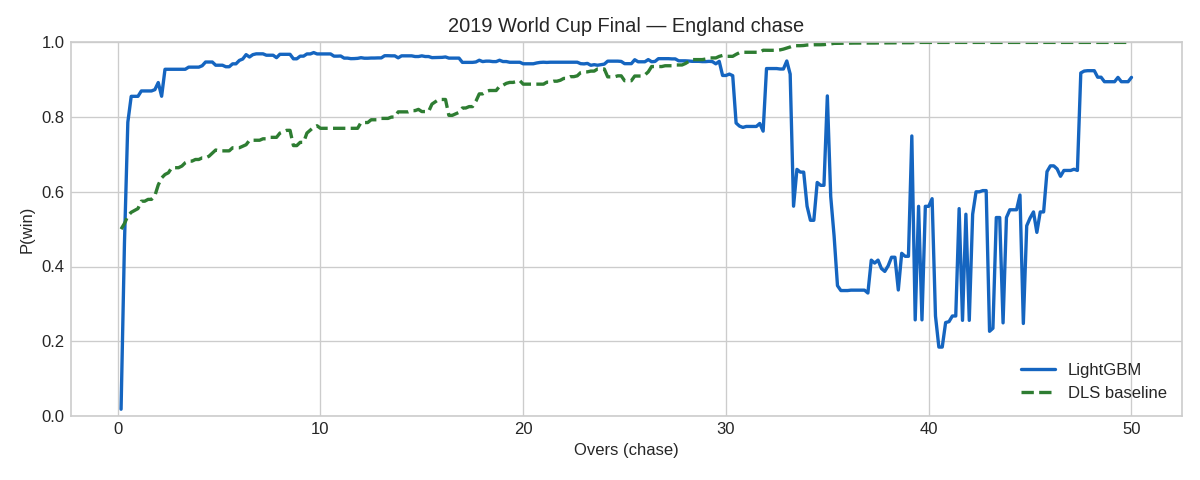
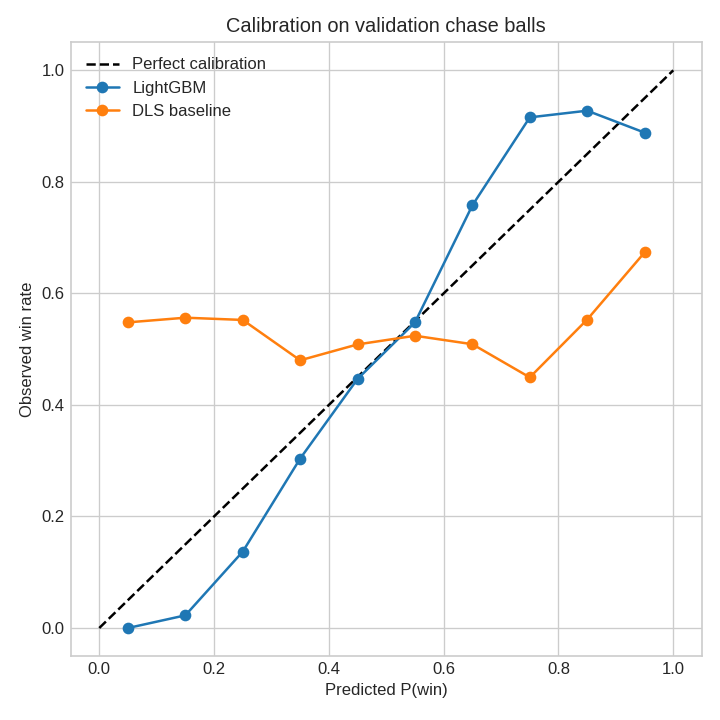
The analysis uses Cricsheet ODI data parsed into game-state features at every ball of the second innings. A simplified DLS-style resource table provides an interpretable baseline; logistic regression and LightGBM models are trained on historical chases and compared on calibration metrics. Interactive Plotly charts showcase famous World Cup matches.
Disclaimer: The DLS implementation here is an educational approximation — not the ICC-official calculator.
Project Structure#
Six notebooks build the analysis step by step:
Key Questions#
When does a chase become statistically unlikely?
How well does a resource table approximate historical outcomes?
Does a machine-learning model improve on DLS-style probabilities?
Which famous chases had the steepest probability swings?
Preview Figures#
Dataset#
Primary source: Cricsheet ODI ball-by-ball JSON
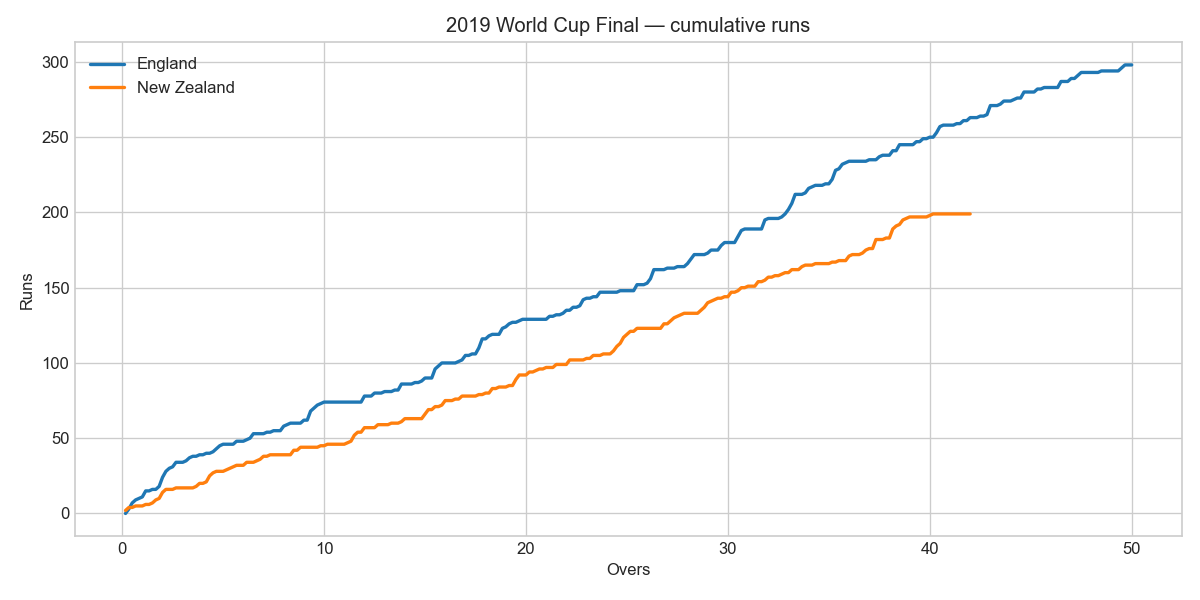
Bundled case studies: 2019 World Cup Final, 2011 WC QF (India vs Australia), 2011 WC upset (Ireland vs England)
Training sample: 400 ODIs, ~120,000 chase balls (see
data/odi_training_sample.csv)
Technical Stack#
Python • Cricsheet • scikit-learn • LightGBM • Plotly • pandas • Sports Analytics • Calibration
Ready to explore?